| 일 | 월 | 화 | 수 | 목 | 금 | 토 |
|---|---|---|---|---|---|---|
| 1 | 2 | 3 | ||||
| 4 | 5 | 6 | 7 | 8 | 9 | 10 |
| 11 | 12 | 13 | 14 | 15 | 16 | 17 |
| 18 | 19 | 20 | 21 | 22 | 23 | 24 |
| 25 | 26 | 27 | 28 | 29 | 30 | 31 |
- #ifndef
- OpenCV
- 환경변수 설정
- DB 데이터
- #undef
- Action
- heroku
- DB 데이터 저장
- #else
- 사이트 도메인
- flask
- #endif
- 성능지표
- MySQL 세팅
- 튜토리얼
- 명령어
- #ifdef
- VS Code
- #if
- 실시간 시계
- 콘솔 가상환경 # 콘솔 #가상환경
- bootstrap
- jinja2
- OpenCV + Flask
- href
- bootstrap4 패키지
- Django
- openweathermap
- PyQt5
- javascript
- Today
- Total
PROGRAMMING
Evaluation Metric 본문
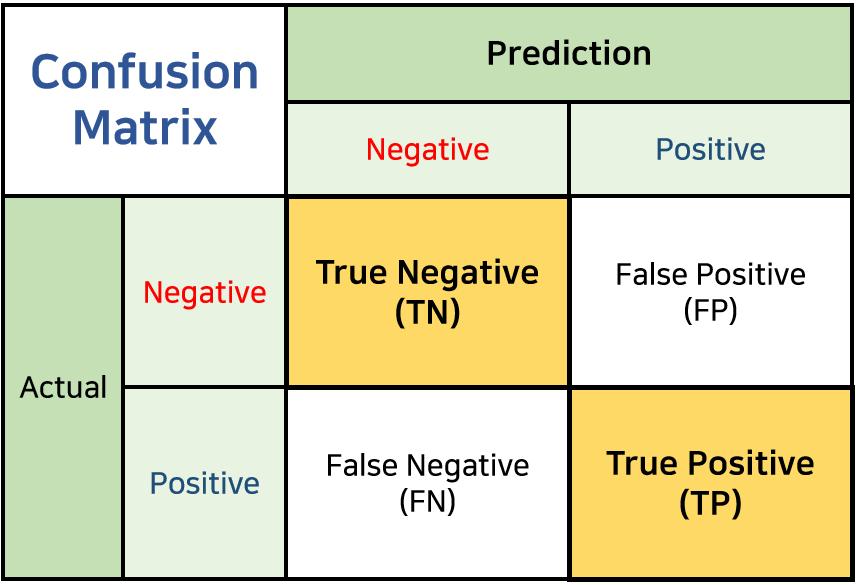
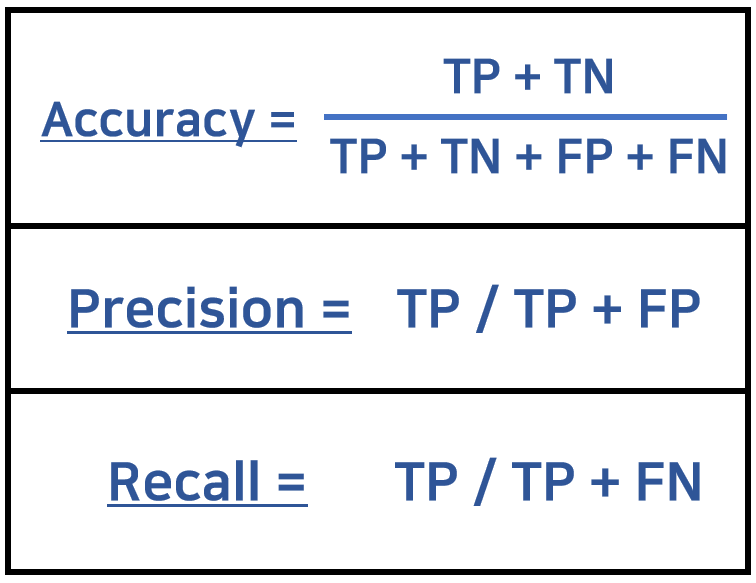
1. Accuracy(정확도), Precision(정밀도), Recall(재현률)
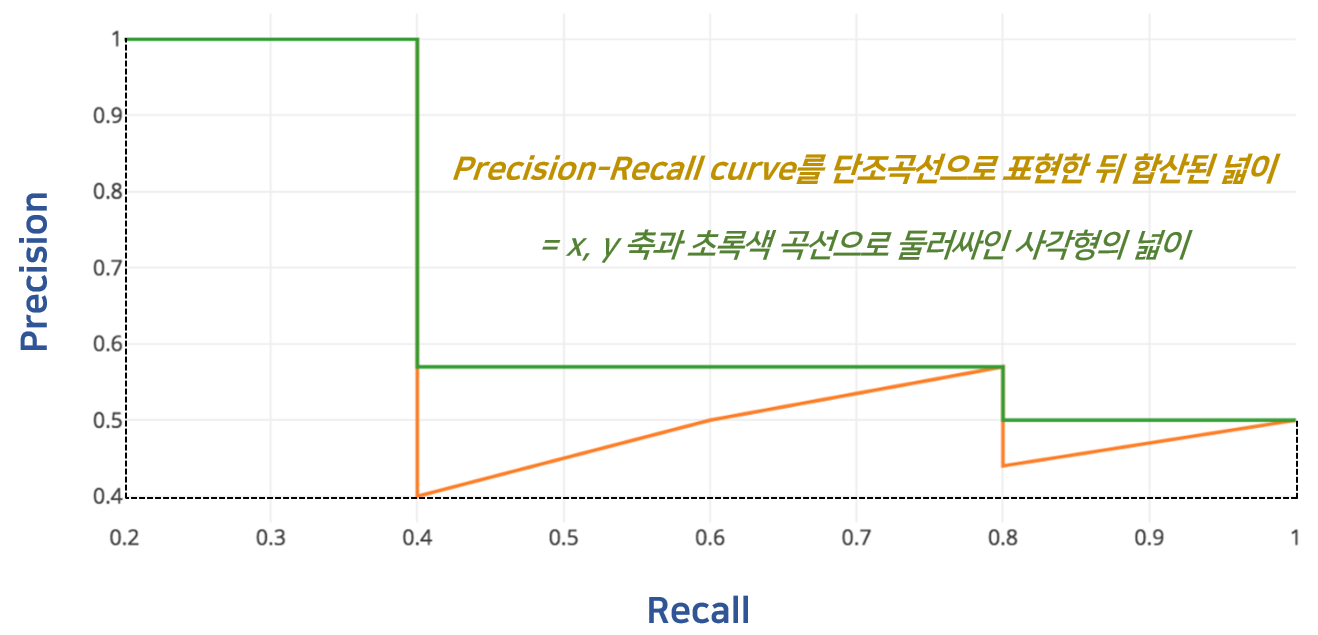
2. Precision-Recall curve, mean Average Precision(mAP)
- Precision-Recall curve: Confidence level의 threshold 값에 따른 precision, recall의 변화추이 그래프
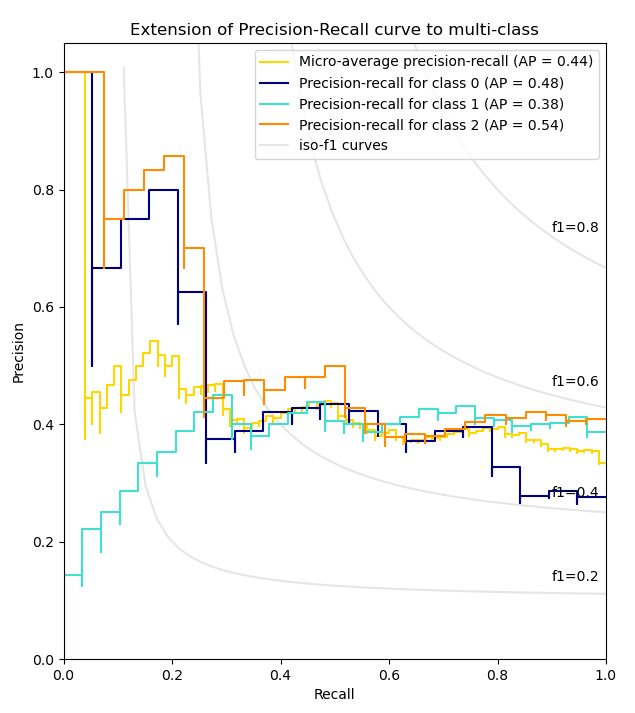
https://scikit-learn.org/stable/auto_examples/model_selection/plot_precision_recall.html
- Average Precision (AP)
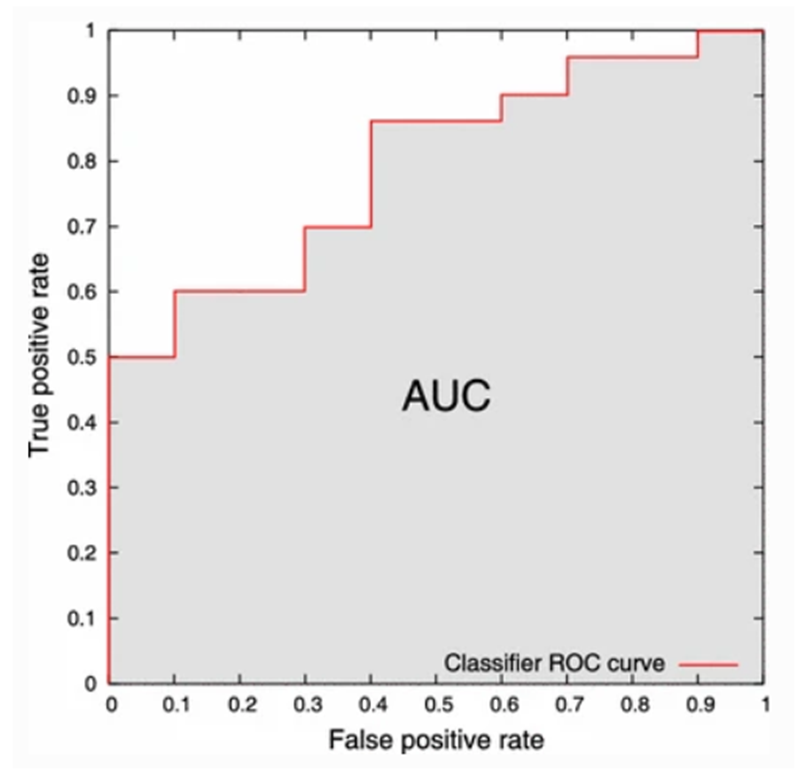
3. AUC-ROC curve
- ROC(Receiver Operating Characteristic) : 각 임계값에서 분류 모형의 성능을 표시한 그래프
- AUC(Area Under the Curve) : ROC 곡선 아래 영역
: 임상에서 정상/환자 구분 시 주로 활용됨.
[ 용어 정의 ]
1) TPR(True Positive Ratio) = Recall = Sensitivity(민감도) = TP / TP + FN
2) FPR(False Positive Ratio) = 1 - Specificity(특이도) = FP / TN + FP
※ Specificity = TN / TN + FP
3) Positive likelihood ratio(양성우도비)
= 환자의 검사 양성확률과 일반인의 검사 양성확률의 비
= TPR / FPR = 민감도 / (1 - 특이도)
4) Negative likelihood ratio(음성우도비)
= 환자의 검사 음성확률과 일반인의 검사 음성확률의 비
= FNR / TNR = (1 - 민감도) / 특이도
5) Positive predictive value(양성예측도) = 검사 결과 양성 시, 질병이 실제 존재할 확률 = TP / TP + FP
6) Negative predictive value(음성예측도) = 검사 결과 음성 시, 질병이 실제로 없을 확률 = TN / FN + TN
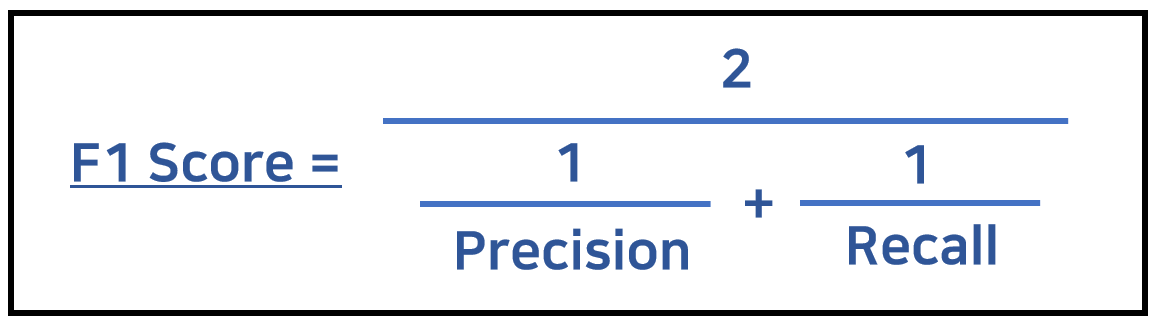
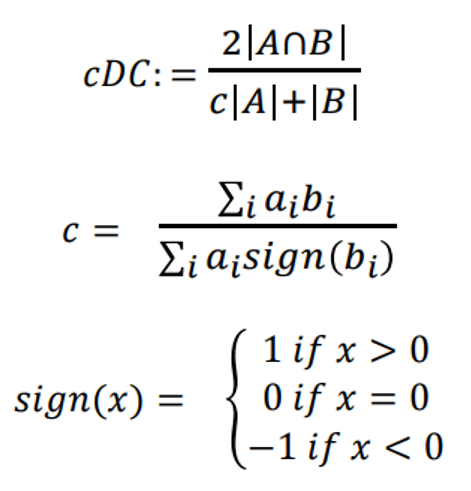
4. Dice (Similarity) Coefficient = F1 score
: 2개의 샘플 간 유사도 비교
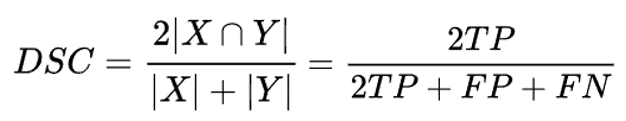
(EX) string similarity measure : Bigrams in string X and Y.
1) string X: night
→ { ni, ig, gh, ht }
2) string Y: nacht
→ { na, ac, ch, ht }
▶ Calculation : (2 * 1) / (4 + 4) = 0.25
- Continuous Dice Coefficient : DC에 비해서 구조 크기의 편향과 partial volume effect로부터 견고한 방식.
+ binary로 분류되는 모델에서는 cDC = DC가 성립.
+ c를 구하는 과정에서 분모가 0인 경우 c = 1로 설정.
※ Shamir, R. R., Duchin, Y., Kim, J., Sapiro, G., & Harel, N. (2019). Continuous dice coefficient: a method for evaluating probabilistic segmentations. arXiv preprint arXiv:1906.11031.
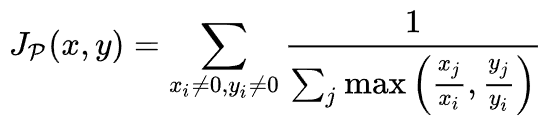
5. Jaccard Index
: 2개의 샘플 간 유사도 비교
+ binary or binarized data에서 활용되며, A, B가 0일 경우 J = 1로 설정.
+ 자카드지수는 0과 1로 이루어진 voxel에서 계산되므로, indicator function의 성질을 만족하고 있음.
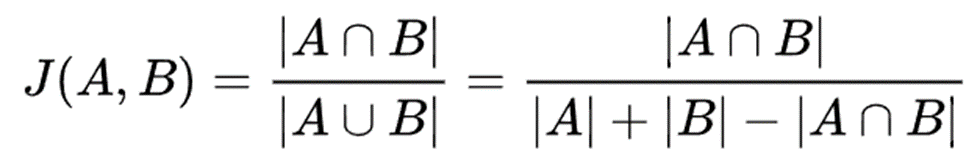
※ Leskovec J, Rajaraman A, Ullman J (2020). Mining of Massive Datasets. Cambridge. ISBN 9781108476348. and p. 76-77 in an earlier version
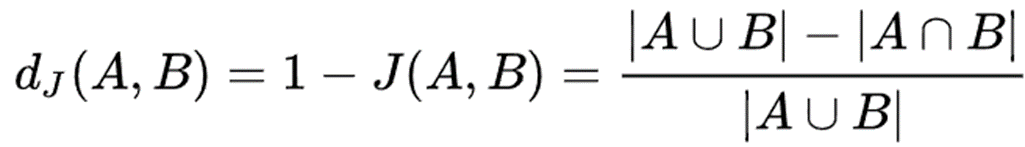
- Jaccard distance : 비유사도 측정
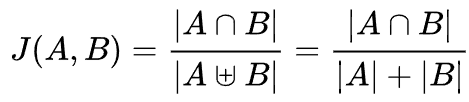
- Weighted Jaccard similarity
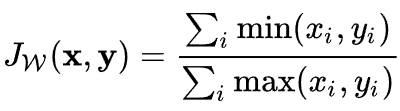
- Probability Jaccard